SaaS Prototype
AI Integration
Slack Team Optimization
Real-time team analytics and chemistry insights
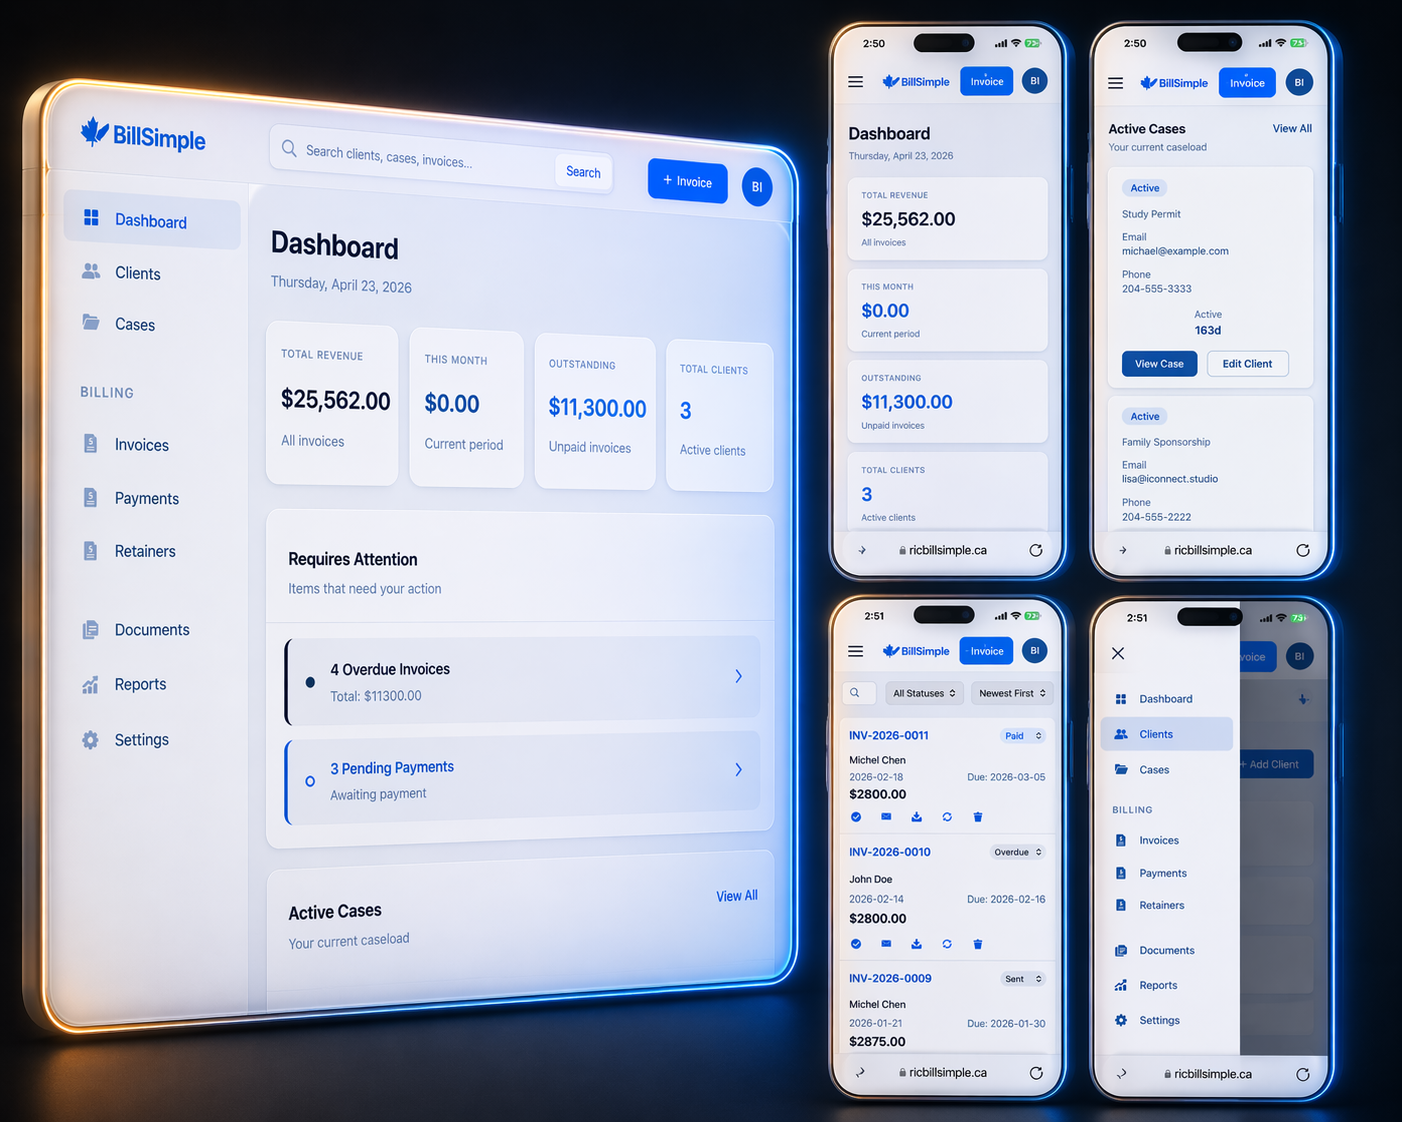
Functional Demo
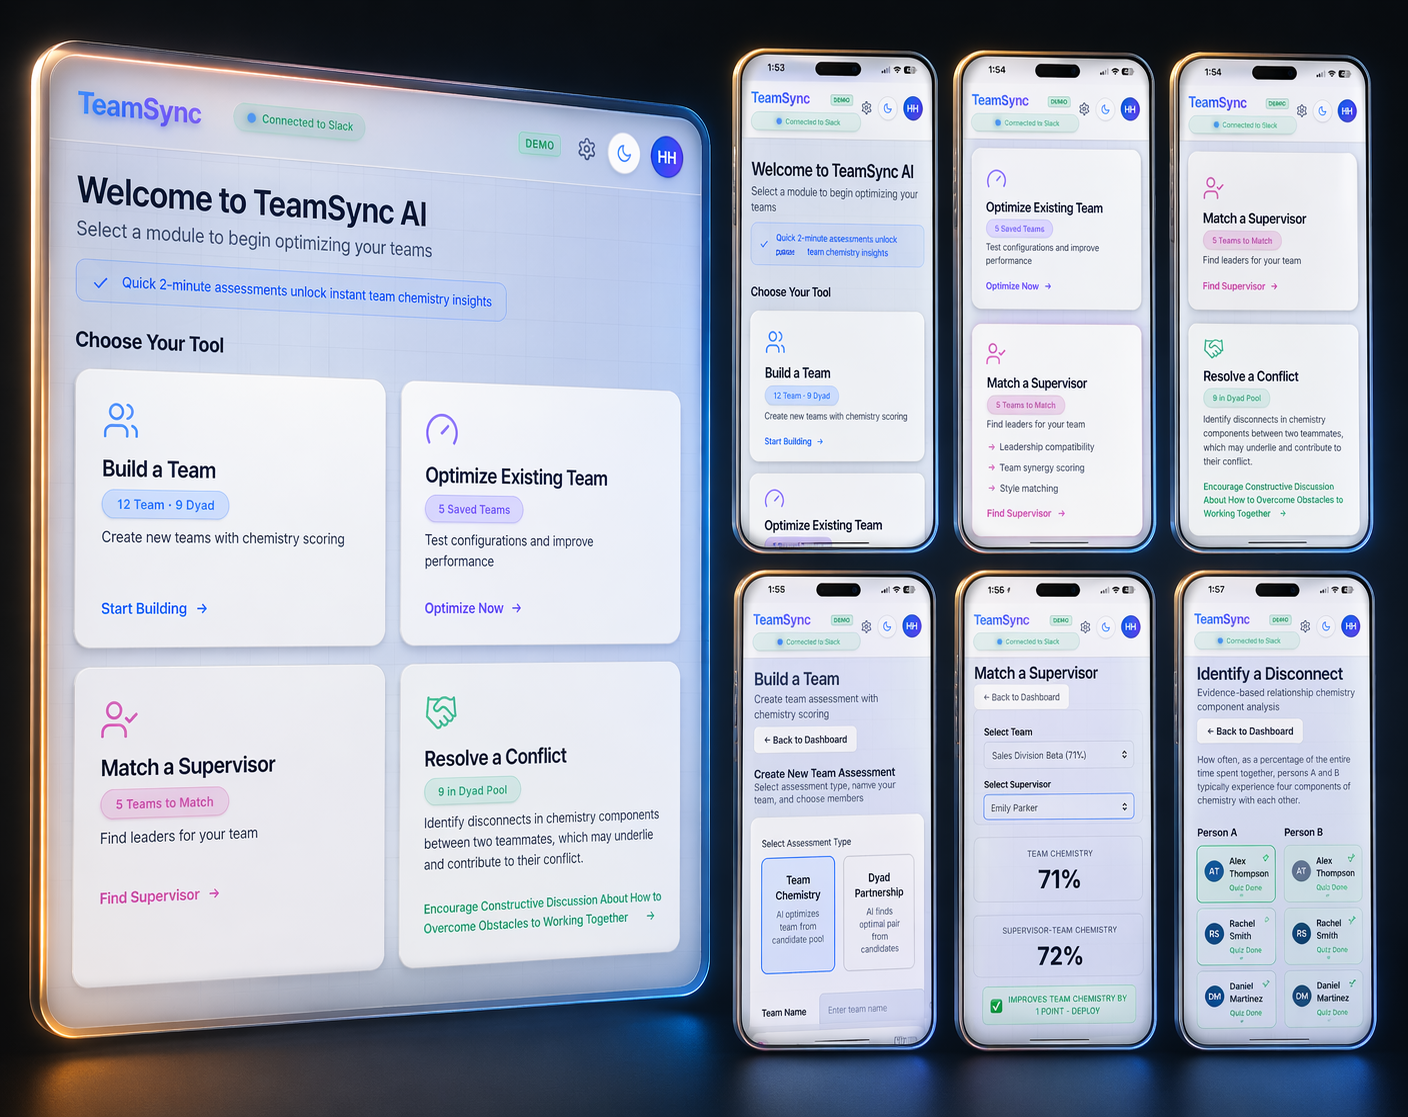
Team optimization dashboard with real-time chemistry scoring
See It Working
Slack Integration Flow
chat
Slack Workspace
Bot sends quiz
→
sync
Webhook Capture
Real-time response
→
psychology
Mental Synchrony
Calculate scores
→
dashboard
Live Dashboard
Instant updates
End-to-end data flow in under 2 seconds
Team Optimization Results
warning Before Optimization
Team Chemistry
62/100
Communication
58/100
Problem Solving
65/100
⚠️ Potential conflict zones detected
check_circle After Optimization
Team Chemistry
89/100
Communication
92/100
Problem Solving
86/100
✓ Optimal team configuration achieved
Performance Metrics
<100ms
Algorithm execution time
1000+
Concurrent Slack users supported
99.9%
Webhook capture accuracy